Washington Commanders vs Dallas Cowboys, Week 2 2026
 Washington Commanders
Away
20
 Dallas Cowboys
HomeWon
37
| Team | Q1 | Q2 | Q3 | Q4 | Final |
|---|---|---|---|---|---|
| Commanders | 0 | 10 | 3 | 7 | 20 |
| Cowboys | 10 | 7 | 10 | 10 | 37 |
WAS 20DAL 37 Final
Passing leader
29.8PPR pts
26/31, 279 YDS, 4 TD
Top fantasy scorer
35.3PPR pts
8 REC, 153 YDS, 2 TD
Commanders leader
21.7PPR pts
5 REC, 47 YDS, 2 TD
Defensive playmaker
K'Lavon Chaisson
1 SACK, 3 TKL
Cowboys 37, Commanders 20: Dallas leads from start to finish
Dallas led 17–10 at halftime and outscored Washington 20–10 after the break to win 37–20. Washington outgained the Cowboys 389–332, but the Cowboys averaged 6.1 yards per play.
The Commanders went 8-for-14 on third down and committed one turnover, while the Cowboys finished without a giveaway.
The two teams meet again in Week 18 of 2026. If you roster anyone from either side, run the start/sit call in Redraft Command and it will weigh your lineup, your opponent and your league scoring, not only the player rankings.
Key advantages
- +0.3 yards/play DAL 6.1 · WAS 5.8
- +1 turnover margin DAL 0 turnovers
- +7% third-down rate DAL 64% · WAS 57%
Game Highlights
Official NFL highlights · Opens from YouTube
Got a Commander or Cowboy on your fantasy team?
Check their next matchup with the Start/Sit Tool, compare their value in the Fantasy Trade Calculator, or connect your league for personalized advice in Redraft Command.
Works with Sleeper, ESPN and Fleaflicker. No password needed.
Why the Cowboys Won
Dallas won the efficiency, turnover, and third-down battles.
| Commanders | Stat | Cowboys |
|---|---|---|
| 5.8 | Yards per play | 6.1 |
| 1 | Turnovers | 0 |
| 57% | Third-down conversion | 64% |
| Other team stats | ||
| 389 | Total yards | 332 |
| 67 | Plays | 54 |
| 31:29 | Time of possession | 28:31 |
Scoring Summary
The Cowboys scored four touchdowns and three field goals; the Commanders scored two touchdowns and two field goals.
| Time | Team | Play | WAS | DAL |
|---|---|---|---|---|
| 1st quarter | ||||
| 10:01 | DAL | Dak Prescott → CeeDee Lamb, 3-yard TD Takes leadBrandon Aubrey XP | 0 | 7 |
| 5:01 | DAL | Brandon Aubrey 25-yard FG Extends lead | 0 | 10 |
| 2nd quarter | ||||
| 13:14 | WAS | Drew Stevens 27-yard FG | 3 | 10 |
| 9:55 | DAL | Dak Prescott → Jake Ferguson, 10-yard TD Extends leadBrandon Aubrey XP | 3 | 17 |
| 6:37 | WAS | Jayden Daniels → Stefon Diggs, 4-yard TDDrew Stevens XP | 10 | 17 |
| 3rd quarter | ||||
| 12:50 | WAS | Drew Stevens 47-yard FG | 13 | 17 |
| 7:20 | DAL | Brandon Aubrey 44-yard FG Extends lead | 13 | 20 |
| 6:32 | DAL | Dak Prescott → Jake Ferguson, 12-yard TD Extends leadBrandon Aubrey XP | 13 | 27 |
| 4th quarter | ||||
| 13:22 | DAL | Brandon Aubrey 60-yard FG Extends lead | 13 | 30 |
| 9:03 | WAS | Marcus Mariota → Stefon Diggs, 20-yard TDDrew Stevens XP | 20 | 30 |
| 3:07 | DAL | Dak Prescott → CeeDee Lamb, 24-yard TD Extends leadBrandon Aubrey XP | 20 | 37 |
Fantasy Points: Commanders vs Cowboys, Week 2 2026
Fantasy leaders
- CeeDee Lamb35.3 PTSWR3
- Dak Prescott29.8 PTSQB3
- Stefon Diggs21.7 PTSWR11
- Jake Ferguson20.3 PTSTE4
Player Stats
Quarterbacks
| Player | FPTS | FIN | CMP/ATT | Pass YDS | TD | INT | Rush ATT | Rush YDS | Rush TD | Rate | Start/Sit |
|---|---|---|---|---|---|---|---|---|---|---|---|
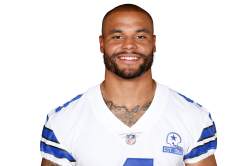
| Dak Prescott | 29.8 | QB3 | 26/31 | 279 | 4 | 0 | 4 | 26 | 0 | 143.8 | Start/Sit → |
| Marcus Mariota | 8.7 | QB26 | 11/16 | 111 | 1 | 0 | 1 | 3 | 0 | 109.1 | Start/Sit → |
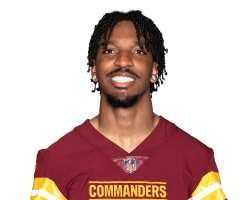
| Jayden Daniels | 14.7 | QB19 | 11/17 | 96 | 1 | 0 | 7 | 69 | 0 | 99.1 | Start/Sit → |

WRs, RBs, & TEs
| Player | FPTS | FIN | POS | Rush ATT | Rush YDS | Rush TD | TGT | REC | Rec YDS | Rec TD | Start/Sit |
|---|---|---|---|---|---|---|---|---|---|---|---|
| CeeDee Lamb | 35.3 | WR3 | WR | — | — | — | 9 | 8 | 153 | 2 | Start/Sit → |
| Stefon Diggs | 21.7 | WR11 | WR | — | — | — | 6 | 5 | 47 | 2 | Start/Sit → |
| Jake Ferguson | 20.3 | TE4 | TE | — | — | — | 4 | 4 | 43 | 2 | Start/Sit → |
| Rachaad White | 14.3 | RB11 | RB | 7 | 43 | 0 | 6 | 6 | 40 | 0 | Start/Sit → |
| George Pickens | 10.0 | WR34 | WR | — | — | — | 8 | 6 | 40 | 0 | Start/Sit → |
| Javonte Williams | 8.0 | RB34 | RB | 12 | 30 | 0 | 4 | 3 | 20 | 0 | Start/Sit → |
| Ryan Flournoy | 7.3 | WR50 | WR | — | — | — | 6 | 5 | 23 | 0 | Start/Sit → |
| Terry McLaurin | 7.0 | WR51 | WR | — | — | — | 9 | 2 | 50 | 0 | Start/Sit → |
| Jacory Croskey-Merritt | 5.8 | RB41 | RB | 12 | 43 | 0 | 1 | 1 | 5 | 0 | Start/Sit → |
| Antonio Williams | 5.4 | WR70 | WR | — | — | — | 3 | 3 | 24 | 0 | Start/Sit → |
| Dyami Brown | 4.1 | WR77 | WR | — | — | — | 6 | 4 | 21 | 0 | Start/Sit → |
| Kaytron Allen | 2.4 | RB63 | RB | 5 | 24 | 0 | — | — | — | — | Start/Sit → |
| Colson Yankoff | 2.4 | TE42 | TE | — | — | — | 1 | 1 | 14 | 0 | |
| Ben Sinnott | 1.6 | TE51 | TE | — | — | — | 1 | 1 | 6 | 0 | Start/Sit → |
| Emari Demercado | 0.8 | RB76 | RB | 3 | 8 | 0 | — | — | — | — | Start/Sit → |
| KaVontae Turpin | 0.1 | WR118 | WR | 1 | 1 | 0 | — | — | — | — | Start/Sit → |
| Hunter Luepke | 0.1 | RB83 | RB | 1 | 1 | 0 | — | — | — | — | Start/Sit → |
| Treylon Burks | 0.0 | — | WR | — | — | — | 1 | 0 | 0 | 0 | Start/Sit → |














Fantasy Usage
Washington Commanders
Snap Share
Target Share34 targets
- Terry McLaurin26%, 9 targets
- Stefon Diggs18%, 6 targets
- Dyami Brown18%, 6 targets
- Rachaad White18%, 6 targets
- Antonio Williams9%, 3 targets
- Other12%, 4 targets
Carry Share32 carries
- , 12 carries
- , 7 carries
- , 7 carries
- , 5 carries
- , 1 carries
Dallas Cowboys
Snap Share
Target Share31 targets
- CeeDee Lamb29%, 9 targets
- George Pickens26%, 8 targets
- Ryan Flournoy19%, 6 targets
- Javonte Williams13%, 4 targets
- Jake Ferguson13%, 4 targets
Carry Share21 carries
- , 12 carries
- , 4 carries
- , 3 carries
- , 1 carries
- , 1 carries
View full usage tableHide full usage table
| Player | SNAPS | SNAP % | TGT | TGT % | CAR |
|---|---|---|---|---|---|
| Javonte Williams | 44 | 80% | 4 | 13% | 12 |
| George Pickens | 42 | 76% | 8 | 26% | 0 |
| Ryan Flournoy | 42 | 76% | 6 | 19% | 0 |
| CeeDee Lamb | 41 | 75% | 9 | 29% | 0 |
| Terry McLaurin | 50 | 70% | 9 | 26% | 0 |
| Ben Sinnott | 48 | 68% | 1 | 3% | 0 |
| Jake Ferguson | 33 | 60% | 4 | 13% | 0 |
| Dyami Brown | 39 | 55% | 6 | 18% | 0 |
| Rachaad White | 37 | 52% | 6 | 18% | 7 |
| Stefon Diggs | 36 | 51% | 6 | 18% | 0 |
| Antonio Williams | 35 | 49% | 3 | 9% | 0 |
| Brevyn Spann-Ford | 21 | 38% | 0 | 0% | 0 |
| Jacory Croskey-Merritt | 26 | 37% | 1 | 3% | 12 |
| John Bates | 22 | 31% | 0 | 0% | 0 |
| Treylon Burks | 21 | 30% | 1 | 3% | 0 |
| Colson Yankoff | 21 | 30% | 1 | 3% | 0 |
| Luke Schoonmaker | 16 | 29% | 0 | 0% | 0 |
| Jonathan Mingo | 11 | 20% | 0 | 0% | 0 |
| Hunter Luepke | 10 | 18% | 0 | 0% | 1 |
| Emari Demercado | 9 | 16% | 0 | 0% | 3 |
| Jaylin Lane | 11 | 15% | 0 | 0% | 0 |
| KaVontae Turpin | 5 | 9% | 0 | 0% | 1 |
| Kaytron Allen | 6 | 8% | 0 | 0% | 5 |




Fantasy Points vs Expected
Expected points (xFP) are what a player's pass attempts, carries and targets are worth at the league's average rates; the difference is what the player made of them.
- Biggest overperformer+19.6CeeDee Lamb35.3 PTS vs 15.7 xFP
- Biggest underperformer−8.7Terry McLaurin7.0 PTS vs 15.7 xFP
- Highest expected volume16.9 xFPDak Prescott29.8 PTS scored
| Player | PTS | xFP | vs xFP | Snap% | Usage | Rte% | Pass att | Car | Car% | Tgt | Tgt% |
|---|---|---|---|---|---|---|---|---|---|---|---|
| Dak PrescottDAL · QB | 29.8 | 16.9 | +12.9 | 100% | 31 att | — | 31 | 4 | 19% | 0 | 0% |
| CeeDee LambDAL · WR | 35.3 | 15.7 | +19.6 | 75% | 29% tgt | — | 0 | 0 | 0% | 9 | 29% |
| Terry McLaurinWAS · WR | 7.0 | 15.7 | −8.7 | 70% | 26% tgt | — | 0 | 0 | 0% | 9 | 26% |
| Rachaad WhiteWAS · RB | 14.3 | 14.7 | −0.4 | 52% | 22% car | — | 0 | 7 | 22% | 6 | 18% |
| Javonte WilliamsDAL · RB | 8.0 | 14.2 | −6.2 | 80% | 57% car | — | 0 | 12 | 57% | 4 | 13% |
| George PickensDAL · WR | 10.0 | 14.0 | −4.0 | 76% | 26% tgt | — | 0 | 0 | 0% | 8 | 26% |
| Jayden DanielsWAS · QB | 14.7 | 12.2 | +2.5 | 55% | 17 att | — | 17 | 7 | 22% | 0 | 0% |
| Dyami BrownWAS · WR | 4.1 | 11.0 | −6.9 | 55% | 18% tgt | — | 1 | 0 | 0% | 6 | 18% |
| Ryan FlournoyDAL · WR | 7.3 | 10.5 | −3.2 | 76% | 19% tgt | — | 0 | 0 | 0% | 6 | 19% |
| Stefon DiggsWAS · WR | 21.7 | 10.5 | +11.2 | 51% | 18% tgt | — | 0 | 0 | 0% | 6 | 18% |
| Jacory Croskey-MerrittWAS · RB | 5.8 | 9.0 | −3.2 | 37% | 38% car | — | 0 | 12 | 38% | 1 | 3% |
| Marcus MariotaWAS · QB | 8.7 | 8.1 | +0.6 | 45% | 16 att | — | 16 | 1 | 3% | 0 | 0% |
| Jake FergusonDAL · TE | 20.3 | 7.0 | +13.3 | 60% | 13% tgt | — | 0 | 0 | 0% | 4 | 13% |
| Antonio WilliamsWAS · — | 5.4 | 5.7 | −0.3 | 49% | 9% tgt | — | 1 | 0 | 0% | 3 | 9% |
| Kaytron AllenWAS · RB | 2.4 | 3.0 | −0.6 | 8% | 16% car | — | 0 | 5 | 16% | 0 | 0% |
| Emari DemercadoDAL · RB | 0.8 | 1.8 | −1.0 | 16% | 14% car | — | 0 | 3 | 14% | 0 | 0% |
| Ben SinnottWAS · TE | 1.6 | 1.7 | −0.1 | 68% | 3% tgt | — | 0 | 0 | 0% | 1 | 3% |
| Colson YankoffWAS · TE | 2.4 | 1.7 | +0.7 | 30% | 3% tgt | — | 0 | 0 | 0% | 1 | 3% |
| Treylon BurksWAS · WR | 0.0 | 1.7 | −1.7 | 30% | 3% tgt | — | 0 | 0 | 0% | 1 | 3% |
| Hunter LuepkeDAL · RB | 0.1 | 0.6 | −0.5 | 18% | 5% car | — | 0 | 1 | 5% | 0 | 0% |
| KaVontae TurpinDAL · WR | 0.1 | 0.6 | −0.5 | 9% | 5% car | — | 0 | 1 | 5% | 0 | 0% |
Team totals: Commanders 34 targets and 32 carries; Cowboys 31 targets and 21 carries. Shares are from the box score. Snap counts are from the weekly player logs (Sleeper), and include plays wiped out by penalties. Route counts, air yards and red-zone touches appear when the tracking feed is connected. League-average rates from the 2026 season: 1.75 PPR points per target (68% catch rate), 0.60 per carry and 0.47 per pass attempt. They don't adjust for field position or target depth.
Fantasy Verdicts
Jayden Daniels
11 of 17 passing for 96 yards, 1 touchdown; 7 carries for 69 yards.
Verdict: The points matched the role, 12.2 expected. Next up: Week 4 against the Colts. Bet on the role more than the result.
Start/Sit: Jayden Daniels →Dak Prescott Ran hot
26 of 31 passing for 279 yards, 4 touchdowns; 4 carries for 26 yards.
Verdict: The opportunities were worth 16.9 points; the touchdowns supplied the rest, and they are the part least likely to repeat. Next up: Week 4 against the Texans. Bet on the role more than the result.
Start/Sit: Dak Prescott →Terry McLaurin Unlucky
9 targets (26% of the team's), 2 catches for 50 yards.
Verdict: The role was there, worth 15.7 points at league-average rates; the production wasn't. Next up: Week 4 against the Colts. Bet on the role more than the result.
Trend: Season high in targets (9).
Rachaad White
6 targets (18% of the team's), 6 catches for 40 yards; 7 carries (22% of the team's) for 43 yards.
Verdict: The points matched the role, 14.7 expected. Next up: Week 4 against the Colts. Bet on the role more than the result.
Trend: Season high in targets (6).
CeeDee Lamb Ran hot
9 targets (29% of the team's), 8 catches for 153 yards and 2 touchdowns.
Verdict: The opportunities were worth 15.7 points; the touchdowns supplied the rest, and they are the part least likely to repeat. Next up: Week 4 against the Texans. Bet on the role more than the result.
Trend: Season high in targets (9).
Javonte Williams Unlucky
4 targets (13% of the team's), 3 catches for 20 yards; 12 carries (57% of the team's) for 30 yards.
Verdict: The role was there, worth 14.2 points at league-average rates; the production wasn't. Next up: Week 4 against the Texans. Bet on the role more than the result.
Start/Sit: Javonte Williams →Dyami Brown Unlucky
1 of 1 passing for 0 yards; 6 targets (18% of the team's), 4 catches for 21 yards.
Verdict: The role was there, worth 11.0 points at league-average rates; the production wasn't. Next up: Week 4 against the Colts. Bet on the role more than the result.
Trend: Season high in targets (6).
Stefon Diggs Ran hot
6 targets (18% of the team's), 5 catches for 47 yards and 2 touchdowns.
Verdict: The opportunities were worth 10.5 points; the touchdowns supplied the rest, and they are the part least likely to repeat. Next up: Week 4 against the Colts. Bet on the role more than the result.
Start/Sit: Stefon Diggs →Start/Sit Decisions
Stock Up, Stock Down
Washington Commanders
- Stock up: Rachaad White led the backfield with 52% of the snaps after trailing Jacory Croskey-Merritt before this game.
- Stock up: Ben Sinnott played 68% of the snaps, up from a 26% season average.
- Stock up: Colson Yankoff played 30% of the snaps, up from a 3% season average.
Dallas Cowboys
- Stock down: Jake Ferguson played 60% of the snaps, down from a 76% season average.
Fantasy Matchups
Fantasy points allowed per game by position, 2026 through Week 3.
| Points allowed to | Commanders D | Cowboys D |
|---|---|---|
| QBs | 28.1 | 23.5 |
| RBs | 12.3 | 25.0 |
| WRs | 46.7 | 27.8 |
| TEs | 21.4 | 13.8 |
Regular season, summed from each game's box score and scored with this page's rules.
How the Game Swung
Dallas opened at 63% win probability and passed 98% in the third quarter on the way to the win.
Cowboys win probability
Key Swings
- +18Prescott → Lamb, 3-yd TD63% → 81%Q1 10:01
- +12Prescott → Ferguson, 10-yd TD82% → 94%Q2 9:55
- −12Daniels → Diggs, 4-yd TD94% → 82%Q2 6:37
- +10Aubrey 44-yd FG75% → 85%Q3 7:20
- +12Prescott → Ferguson, 12-yd TD86% → 97%Q3 6:32
Swing in Cowboys win probability, in points
Play Calling and Possessions
| Washington Commanders | Measure | Dallas Cowboys |
|---|---|---|
| 67 | Plays | 54 |
| 52% | Pass rate | 61% |
| 5.9 | Yds / dropback | 8.1 |
| 5.7 | Yds / carry | 3.1 |
| 8/14 | Third downs | 7/11 |
Efficiency edge Dallas ran 13 fewer plays but gained 2.2 more yards per dropback.
- Top targets
- WAS McLaurin 26% · Brown 18% · White 18%
- DAL Lamb 29% · Pickens 26% · Flournoy 19%
Possession Results
| Result | WAS | DAL |
|---|---|---|
| Touchdowns | 2 | 4 |
| Field goals | 2 | 3 |
| Punts | 1 | 1 |
| Turnovers | 1 | 0 |
| Missed field goals | 1 | 0 |
DAL turnover edge: +1
- The Cowboys opened the scoring on their first possession, a 10-play, 66-yard drive that ended in a touchdown.
- The Cowboys scored touchdowns on two of their first three drives, then drained the clock with two second-half drives of five to six minutes.
All 17 possessions, drive by drive
| Team | Start | Plays | Yards | Time | Result |
|---|---|---|---|---|---|
| DAL | Q1 15:00 | 10 | 66 | 4:59 | Touchdown |
| WAS | Q1 10:01 | 3 | 7 | 1:56 | Punt |
| DAL | Q1 8:05 | 8 | 58 | 3:04 | Field goal |
| WAS | Q1 5:01 | 13 | 73 | 6:47 | Field goal |
| DAL | Q2 13:14 | 7 | 65 | 3:19 | Touchdown |
| WAS | Q2 9:55 | 8 | 66 | 3:18 | Touchdown |
| DAL | Q2 6:37 | 3 | -4 | 1:36 | Punt |
| WAS | Q2 5:01 | 15 | 64 | 5:01 | End of half |
| WAS | Q3 15:00 | 6 | 31 | 2:10 | Field goal |
| DAL | Q3 12:50 | 9 | 38 | 5:30 | Field goal |
| WAS | Q3 7:20 | 1 | -6 | 0:12 | Fumble |
| DAL | Q3 7:08 | 2 | 13 | 0:36 | Touchdown |
| WAS | Q3 6:32 | 9 | 32 | 4:39 | Missed FG |
| DAL | Q3 1:53 | 7 | 17 | 3:31 | Field goal |
| WAS | Q4 13:22 | 10 | 73 | 4:19 | Touchdown |
| DAL | Q4 9:03 | 11 | 83 | 5:56 | Touchdown |
| WAS | Q4 3:07 | 5 | 24 | 3:07 | End of game |
About these numbers
Possessions that ended with the clock running out at the half or the end of the game aren't counted.
Personnel groupings, average depth of target and pass rate over expected appear when the tracking feed is connected.
Commanders vs Cowboys Head-to-Head
The Commanders and Cowboys first met in 1960 and have played 133 times since. They have been NFC East rivals since 1970.
- All-time series
- 82–49–2Cowboys lead, 133 meetings since 1960
- Postseason
- 2–0Commanders won in 1972 and 1982
- Largest Commanders win
- 35–72005
- Largest Cowboys win
- 56–142021
Since 2021
9–2 Cowboys lead
11 meetings since the 2021 season, regular season and playoffs.
Oldest to newest. DAL = Cowboys win, WAS = Commanders win, outlined = this game.
2026 Meetings
- Week 18 Cowboys at Commanders Upcoming
Recent Meetings
- 2026 Wk 2 Commanders at Cowboys DAL 37 WAS 20 DAL W
- 2025 Wk 17 Cowboys at Commanders, 2025 Wk 17 recap DAL 30 WAS 23 DAL W
- 2025 Wk 7 Commanders at Cowboys, 2025 Wk 7 recap DAL 44 WAS 22 DAL W
- 2024 Wk 18 Commanders at Cowboys, 2024 Wk 18 recap WAS 23 DAL 19 WAS W
- 2024 Wk 12 Cowboys at Commanders, 2024 Wk 12 recap DAL 34 WAS 26 DAL W
- 2023 Wk 18 Cowboys at Commanders, 2023 Wk 18 recap DAL 38 WAS 10 DAL W
- 2023 Wk 12 Commanders at Cowboys, 2023 Wk 12 recap DAL 45 WAS 10 DAL W
- 2022 Wk 18 Cowboys at Commanders, 2022 Wk 18 recap WAS 26 DAL 6 WAS W
- 2022 Wk 4 Commanders at Cowboys, 2022 Wk 4 recap DAL 25 WAS 10 DAL W
- 2021 Wk 16 Commanders at Cowboys, 2021 Wk 16 recap DAL 56 WAS 14 DAL W
- 2021 Wk 14 Cowboys at Commanders, 2021 Wk 14 recap DAL 27 WAS 20 DAL W
Season to Date (Through Week 3)
The 2026 regular season, from each game's box score.
| Commanders | Stat | Cowboys |
|---|---|---|
| 1-2 | Record | 1-2 |
| 25.0 | Points per game | 29.3 |
| 314.0 | Yards per game | 330.3 |
| 4.7 | Yards per play | 5.6 |
| 30.7 | Points allowed per game | 27.3 |
| 362.3 | Yards allowed per game | 387.0 |
Commanders vs Cowboys Odds and Results
How this game finished against the betting lines.
- Spread
- DAL −4.5Cowboys covered by 12.5
- Total
- 51.5Over: 57 points scored (by 5.5)
Expected vs Actual Scoring
| Team | Implied | Actual | Difference |
|---|---|---|---|
| Cowboys | 28.0 | 37 | +9.0 |
| Commanders | 23.5 | 20 | −3.5 |
The Cowboys beat their implied total and the Commanders fell short of theirs; the Fantasy tab has the player lines behind it.
Betting Trends
Last 6 meetings: Cowboys 4–2 ATS, overs and unders 3–3.
Each team's 2026 season through this game. Over/under is overs first.
Washington Commanders
- Against the spread
- 1–1
- Over/under
- 2–0
- ATS as underdog
- 1–1
- ATS on the road
- 1–1
Dallas Cowboys
- Against the spread
- 1–1
- Over/under
- 2–0
- ATS as favorite
- 1–1
- ATS at home
- 1–0
Lines: ESPN's consensus, captured at kickoff. Individual sportsbooks varied.
21+. Gambling problem? Call 1-800-GAMBLER. Betting availability depends on your state.
Commanders vs Cowboys Fantasy Outlook for 2026
One meeting is left on the 2026 schedule: Week 18 in Washington. Here's how to decide who to play in your league.
- Start/Sit ToolShould your Commanders or Cowboys player start in Week 18? Compare the decision against your other options.
- Fantasy Football ProjectionsSee the latest weekly and rest-of-season projections for Commanders and Cowboys players.
- Fantasy Points Allowed by PositionHow the Commanders and Cowboys defenses have treated QBs, RBs, WRs and TEs.
- Strength of ScheduleWhere this matchup falls in each team's fantasy playoff run.
- Redraft CommandConnect your league for personalized lineup, trade and roster advice.
Keep Exploring
2026 Game Logs for Players in This Game
Commanders vs Cowboys Game FAQ
Who won the 2026 Commanders vs Cowboys Week 2 game?
The Dallas Cowboys beat the Washington Commanders 37–20 in Week 2 of the 2026 season. The game was played at AT&T Stadium in Arlington, TX, on September 20, 2026. See the Cowboys' 2026 schedule.
What was the final score of Commanders vs Cowboys?
The final score was Cowboys 37, Commanders 20. The Cowboys led 17–10 at halftime, and the second half went Commanders 10, Cowboys 20.
What happened in the Commanders vs Cowboys game?
Dallas led 17–10 at halftime and outscored Washington 20–10 after the break to win 37–20. Washington outgained the Cowboys 389–332, but the Cowboys averaged 6.1 yards per play. CeeDee Lamb led all players with 8 catches for 153 yards and 2 touchdowns. The Commanders committed 1 turnover, the Cowboys none.
Who scored the most fantasy points in Commanders vs Cowboys?
CeeDee Lamb led the game with 35.3 PPR fantasy points, the WR3 of Week 2, on 8 catches for 153 yards and 2 touchdowns. Dak Prescott was next with 29.8 (QB3). See CeeDee Lamb's 2026 game log.
Who led Commanders vs Cowboys in passing, rushing and receiving?
Dak Prescott (DAL) led all passers with 26 of 31 for 279 yards and 4 touchdowns. Jayden Daniels (WAS) led in rushing with 7 carries for 69 yards. CeeDee Lamb (DAL) led in receiving with 8 catches for 153 yards and 2 touchdowns.
How many fantasy points did CeeDee Lamb score against the Commanders?
CeeDee Lamb scored 35.3 points in PPR leagues, 31.3 in half-PPR and 27.3 in standard scoring against the Commanders in Week 2 of the 2026 season, on 8 catches for 153 yards and 2 touchdowns. He drew 29% of his team's targets.
Who outperformed and underperformed expected fantasy points in Commanders vs Cowboys?
CeeDee Lamb outperformed his expected fantasy points the most, scoring 35.3 PPR points on 15.7 xFP (+19.6). Terry McLaurin fell furthest short, with 7.0 points on 15.7 xFP (−8.7). A gap either way reflects efficiency and touchdowns in one game; it is not a forecast. For matchups ahead, see fantasy points allowed by position.
How did the Cowboys beat the Commanders?
The Cowboys beat the Commanders 37–20 because they averaged 6.1 yards per play to 5.8 and won the turnover battle 1–0.
Which team won the turnover battle in Commanders vs Cowboys?
The Cowboys won the turnover battle 1–0: the Commanders gave the ball away 1 time and the Cowboys not at all. The Cowboys won the game.
What is the all-time Commanders vs Cowboys record?
The Cowboys lead the all-time series 82–49–2 across 133 meetings since 1960, including a 0–2 record in the postseason.
When did the Commanders and Cowboys last play before this game?
Before Week 2 of 2026, they last met in the 2025 season on December 25, 2025, when the Cowboys beat the Commanders 30–23.
Have the Commanders and Cowboys met in the playoffs?
Yes, 2 times, most recently in the 1982 playoffs. The Commanders are 2–0 against the Cowboys in the postseason.
What was the closing spread for Commanders vs Cowboys?
The consensus closing spread at kickoff was Cowboys −4.5, making the Dallas Cowboys 4.5-point favorites, with a closing total of 51.5. That implied about 28.0 points for the Cowboys and 23.5 for the Commanders.
Did Commanders vs Cowboys go over or under the total?
The game went over. The consensus closing total was 51.5, and the teams combined for 57 points, 5.5 over the number.
Who covered the spread in Commanders vs Cowboys?
The Cowboys covered by 12.5 against the closing line of Cowboys −4.5. The final margin was 17 points.