
AFC East · 2026 Season
Buffalo Bills
Buffalo Bills fantasy football hub
Buffalo Bills









Buffalo Bills Fantasy Football Outlook & Stats 2026
Buffalo scored 28.3 points a game and led the NFL in rushing, and did it with a passing game that finished 13th in yards and produced no 750-yard receiver. Josh Allen ran for 14 touchdowns, nearly half of the team's 30 on the ground. Joe Brady takes over as head coach and DJ Moore arrives to fix the one part of this offence that was not working.
- Head coach
- Joe Brady (first season)
- Arrivals
- DJ Moore
- Scoring
- 28.3 pts/g 4th in the NFL
- Rushing
- 159.6 yds/g 1st in the NFL
- Passing
- 234.2 yds/g 13th in the NFL
- Rushing TDs
- 30
Core fantasy pieces
The passing line came down and it did not matter, because the touchdowns moved to his legs.
- 3,668 pass yds
- 25 pass TD
- 14 rush TD
3,668 passing yards and 25 touchdowns is the quietest line of his prime, and he still finished as a top-two fantasy quarterback because 14 of Buffalo's 30 rushing scores were his own. That is the whole case: the rushing floor is not a bonus on top of the passing, it is the larger half of the total, and it does not depend on a receiver winning. A 69.3% completion rate at a 102.2 rating says the efficiency is intact — the volume simply went to the ground.
A 1,621-yard season on 309 carries, in the league's best rushing offence.
- 1,621 rush yds
- 12 TD
- 5.2 yds/carry
He carried it 309 times for 1,621 yards at 5.2 a pop and scored 12 times, behind a line that produced the most rushing yards per game in football. The workload is the appeal and also the only real worry — 342 touches is a lot to ask twice. The receiving work is the soft spot: 33 catches on 40 targets is a genuine role, but it is not the 60-reception floor that carries a back through a bad week.
The most accomplished route-runner Buffalo has ever handed Allen.
- Offseason arrival
- 50 rec, 682 yds
- 85 targets
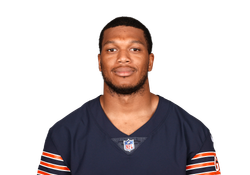
Fifty catches for 682 yards and six scores in Chicago is not a WR1 line, and it is still better than anything this receiving room produced last season. He walks into a target tree with no established alpha, for a quarterback who has never had one. The caution is what the rankings imply: Buffalo threw for 234 yards a game and finished 13th doing it, so the volume that would make him a WR2 has to be created rather than inherited.
The most efficient pass-catcher on the roster, in the fewest games.
- 39 rec, 571 yds
- 14.6 yds/rec
- 12 games
Fourteen-point-six yards a reception is a field-stretching number from a tight end, and the 47.6 yards a game he managed across twelve appearances would have put him inside the position's top ten over a full season. He got there on 49 targets and a 37% snap rate, which is the whole argument in both directions — the per-route work is elite and the volume behind it is not there yet. Twelve games is now the third straight season cut short. Buy the rate; do not pay for seventeen games of it.


The rest of the passing game
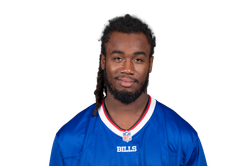
Led the team in targets and receptions, and it took only 95 looks to do it.
- 72 rec, 719 yds
- 95 targets
- 4 TD
Seventy-two catches on 95 targets is an outstanding catch rate and it was the most secure role in the receiving room. The problem is the number beside it: 719 yards led all Buffalo receivers, which says more about the offence than about him. DJ Moore's arrival is aimed squarely at this share, and at 10.0 yards a reception there is no ceiling underneath it to fall back on — the floor is real and it is all there is.
Two seasons in, the production has not caught up to the draft slot.
- 38 rec
- 404 yds
- 13 games
404 yards on 59 targets in his second season is the kind of line that gets a receiver drafted a round later every year until it changes. The physical profile is still the reason to look, and DJ Moore's arrival makes the case harder rather than easier — the targets a breakout would have needed now have somewhere else to go.
The only back who matters if Cook's 342 touches catch up with him.
- 275 rush yds
- 4.7 yds/carry
- 17 games
Fifty-eight carries at 4.7 a go and two receiving scores is a backup's line, and it was earned across all seventeen games behind a healthy starter. That is the point of him: the handcuff to a 300-carry back in the league's top rushing offence is worth a bench spot on its own, and no third back in the room is contesting it.
Bottom lineAllen and Cook are the offence and both are priced like it. Everything after them is a bet on a passing game whose leading receiver managed 719 yards — DJ Moore is the reason to think that number moves, and a first-year head coach is the reason not to assume it.
Usage & Opportunity Report
Updated through Week 4 · refreshed every Tuesday
Fantasy production follows opportunity, not the other way around — so this report tracks who's on the field and who the ball is going to, before the box score catches up. The essentials: target share (share of team pass attempts), snap share, and red-zone touches. The premium layer, in each player's expandable profile: first-read share (how often the play is designed for him), air-yards share (30%+ is the alpha-receiver threshold), and expected fantasy points (xFP) vs. fantasy points over expected (FPOE) — xFP is stable, repeatable volume; FPOE is efficiency that regresses. Route share (the % of dropbacks a player runs a route on — the stat that matters most for tight ends), targets per route run (TPRR) and yards per route run (YPRR — the best receiver efficiency stat there is) join the profiles when the league's route data is published. Since 2017, receivers at a 20%+ target share average 15.3 fantasy points per game; the 10–20% group averages 9.8. That cliff is why this table exists.
- Pass rate over expected−1.2%15thThrows about as much as situations call for — the target tree, not the play-calling, decides who eats
- Red-zone pass rate52%23rdRun-first inside the 20 — Allen's legs cap the receivers' TDs
- Neutral pace31.3s4th fastestSeconds per play in neutral situations — a fast offense means more snaps for every starter
- Plays per game59.716thOffensive plays a game — league-average volume, so shares decide it
- Team xFP / game91.112thTotal expected fantasy points this offense creates
The Target Tree
All 86 Bills pass attempts through Week 4
- DJ Moore 20.9%
- Dalton Kincaid 19.8%
- Khalil Shakir 17.4%
- Keon Coleman 10.5%
- James Cook 9.3%
- Palmer/Knox/Johnson 15.1%
- Everyone else 2.3%
- No target (throwaways, spikes, batted) 4.7%
The Backfield Split
Who owns which situations — the RB stat that actually predicts the box score.
- James Cook 88.1%
- Ty Johnson 9.5%
- Ray Davis 1.2%
- Other backs 1.2%
Share of the backs' carries + targets in each situation. Snap-by-snap splits need the league's participation data, which is published after the season.
- 24.7Cook weighted opps/game — RB8 in the NFL
- 13Cook high-value touches (in-10 carries + targets)
- 8.0Johnson weighted opps/game
- +1.8Cook wOpp/g vs. last season — role grew, not just efficiency
Why Cook's floor holds in PPR: He keeps 67% of the backfield's targets as well as the early downs, so his catches don't depend on game script — a 23-catch pace. Trailing by 7+, he still gets 77% of the backs' work — no one takes the hurry-up snaps from him.
The Johnson math if Cook misses time: Johnson is next in line by weighted opportunities. A Cook absence projects Johnson to ~61% of weighted opportunities — about 20.4 a game, an RB2 by volume — worth a bench spot in deeper leagues.
Run Direction — carries & yards per carry by gap
- -1.52 attLeft end
- 4.98 attLeft tackle
- 5.356 attMiddle
- 5.08 attRight tackle
- 6.03 attRight end
Designed runs only; "Middle" includes runs behind either guard.
The interior is the run game's engine: 5.3 yards per carry up the middle on 56 attempts, 73% of all designed runs. The edges are a change-up, not the plan — when an interior lineman sits out practice, that's a usage note, not just an injury note.
Where Allen Attacks
Share of pass attempts & yards per attempt by field zone — through Week 4
- 6%0.0 YPADeep left
- 6%15.4 YPADeep middle
- 6%31.6 YPADeep right
Line of scrimmage · deep = 20+ air yards
- 24%8.8 YPAShort left
- 22%9.5 YPAShort middle · Kincaid
- 36%6.0 YPAShort right
The short middle is the efficiency engine (9.5 YPA) — and it's Kincaid's territory. Allen keeps 83% of his throws under 20 air yards, with the deep right his most explosive zone (31.6 YPA on 5 attempts). Gold = highest-YPA high-volume zone.
| Profile | Player | Opportunity (WOPR) | Target share | Snap share | RZ touches | Read |
|---|---|---|---|---|---|---|
| James CookRB1, 91% of RB touchesRB8 in weighted opps/game, NFL | —touch share 91% | 9.3%−10.0 vs W1 | 71%−5 vs W1 | 113 · 5 · 3 — leads team | Set & forget | |
The locked-in workhorse. A 100% share of the backs' red-zone work is the RB stat that tracks fantasy points best, and 5 green-zone carries put him at the goal line. Production is running +0.7 over expected, so this is volume, not a hot streak. Bars show percentile vs. all NFL RBs. | ||||||
| DJ MooreWR1WR29 in target share, NFL | 0.54strong — elite at 0.60 | 20.9%+10.9 vs W1 | 55%−12 vs W1 | 2 ▲0 · 0 · 2 | Set & forget | |
The alpha profile, fully formed. A 32.2% air-yards share clears the 30% alpha threshold, a 23.6% first-read share says the offense is designed through him, and a 15.8-yard aDOT keeps his ceiling high and his floor jumpy. Production is running right at expected, so this is volume, not a hot streak. Bars show percentile vs. all NFL WRs. | ||||||
| Dalton KincaidTE1TE6 in target share, NFL | 0.47elite for TE | 19.8%−9.2 vs W1 | 68%−5 vs W1 | 10 · 1 · 0 | Starter | |
A starter's share without the alpha tag. A 19.8% target share and 11 expected points a game, with a 21.8% first-read share; a 24.7% air-yards share decides how much of that turns into yards. He's scoring +3.8 points a game over expected — some of that is efficiency that regresses, but the 11 xFP floor holds. Bars show percentile vs. all NFL TEs. | ||||||
| Khalil ShakirWR2WR42 in target share, NFL | 0.36flex range | 17.4%−9.2 vs W1 | 58%+20 vs W1 | 43 · 0 · 1 | Starter | |
A starter's share without the alpha tag. A 17.4% target share and 10.4 expected points a game, with a 21.8% first-read share; a 13.9% air-yards share decides how much of that turns into yards. He's −4.9 a game against expected: the volume is there and the box score hasn't caught up — a buy signal, not a warning. Bars show percentile vs. all NFL WRs. | ||||||
| Keon ColemanWR3WR71 in target share, NFL | 0.25below startable | 10.5%+4.3 vs W1 | 59%steady | 10 · 1 · 0 | Volatile | |
Not enough of the pie. A 10.5% target share is under the line where weekly fantasy value lives, and a 12.7% first-read share says he's rarely the design. He needs an injury above him or a role change, not a better matchup. Bars show percentile vs. all NFL WRs. | ||||||
| Josh AllenQB1QB1 in xFP/game, NFL | —every dropback | —the passer | 100%steady | 7 ▲1 · 3 · 3 | Set & forget | |
The goal-line QB. 5 green-zone carries in 3 games and a 13.7% designed-run rate — with a 40% pass rate inside the 10, the most valuable real estate in fantasy goes to his legs as often as his arm. His xFP alone (QB1 league-wide) justifies the price before any efficiency. Bars show percentile vs. all NFL QBs. | ||||||
How to read this table
- Set & forget 20%+ target share or locked bell-cow role — start everywhere
- Starter 17–19% target share or a lead back's full workload — weekly lineup play
- Flex 15–16% share or a committee lead — matchup-dependent
- Volatile under 15% — deep leagues only
- Stash the role behind the role
- WOPR: 1.5 × target share + 0.7 × air-yards share
- + button: opens the full advanced profile — first-read share, air-yards share, xFP/FPOE — with percentile bars vs. the league
Buy low
Khalil Shakir
The volume is there and the points aren't — yet. 10.4 expected points a game against 5.5 actual is the gap that closes on its own. Trade for him before it does.
- 10.4xFP per game
- −4.9points vs. expected per game
Sell high
Dalton Kincaid
Season totals still read like a starter, but the share just fell to a season low. Name value currently exceeds trajectory.
- −9.2target share pts since W1
- 11.5%W3 share — season low
Usage trends are one of the core inputs behind our player pricing — Redraft Command re-runs every player's value as these shares move, so a riser like Shakir gets repriced before your leaguemates notice.
Data: nflverse play-by-play · nflverse snap counts (PFR) · FTN Data charting via nflverse (first-read share) · ffopportunity expected points (xFP). Regular season, through Week 4.
Coaching Profile & Tendencies
Play-calling tendencies carry over from season to season when the play-caller stays the same — and become unreliable the moment he changes. That's the whole reason this module exists: before you trust any Bills projection, you need to know whose fingerprints are on the offense and how stable they are. For the Bills the answer is stable: Joe Brady called this offense last season too — his third year on its call sheet — so last year's tendencies still mean something.
Head coach · Third season as caller here · Primary play-caller
Joe Brady
Saints / Sean Payton lineage
Promoted from offensive coordinator to head coach and explicitly said he plans to continue calling Buffalo's offensive plays from the sideline.
- LSU passing-game coordinator — record-setting title offense2019
- Carolina Panthers offensive coordinator2020-21
- Bills QB coach; interim OC & play-caller from Week 11 of 2023, then OC2022-25
- Buffalo Bills head coach & play-caller2026
Tendency reliability
Same play-caller as last season — his third season calling this offense. Last year's tendencies are a valid baseline for projecting it.
Play-caller ledgerBrady — 3 of 3 games in 2026 · 2 full prior seasons as caller here + partial 2023 (Wks 11+)
| Tendency | 2025 (Brady) | 2026 (Brady) | Change | NFL avg. |
|---|---|---|---|---|
| Pass rate (all downs) | 55.3% | 56% | +0.7 | 60% |
| Pass rate over expectedsituation-adjusted | −3.5% | −1.2% | +2.3 | 0% |
| Neutral pacesec/play, neutral game state | 34.9s | 31.3s | faster | 33s |
| Early-down pass rate1st & 2nd down | 50.3% | 52.8% | +2.5 | 55% |
| No-huddle rate | 6.2% | 3.9% | −2.3 | 6% |
| Play-action rateshare of dropbacks, FTN charting | 25.5% | 31.7% | +6.2 — 6th in NFL | 24% |
| Motion at snapFTN charting | 60% | 64.8% | +4.8 — 7th in NFL | 58% |
| Shotgun rate | 50.2% | 43.6% | −6.6 | 59% |
| Red-zone pass rate | 46% | 52% | +6 | 56% |
| 4th-down go rateopponent territory, 2 yds or less | 95% | — | — | 75% |
31.3ssec/play
The offense sped up.
Neutral pace quickened from 34.9s to 31.3s per snap. Faster pace compounds into extra plays per game — raw opportunity for every skill player, the quietest fantasy upgrade a staff can hand out.
43.6shotgun
More under center.
Shotgun rate fell from 50.2% to 43.6% — more under-center snaps, which usually travels with a heavier run game and play-action rather than quick game.
31.7play-action
More play-action.
Play-action rate rose from 25.5% to 31.7% of dropbacks. Play-action throws travel farther and produce more yards per attempt league-wide — a boost to downfield receiver efficiency.
Offensive coordinator · Delegation watch
Pete Carmichael Jr.
Saints OC 2009–23; primary play-caller after Sean Payton's 2011 injury, throughout Payton's 2012 suspension, for much of 2016, in spot duty during Payton's 2021 absence, and as the primary caller under Dennis Allen in 2022–23
A coordinator who has run his own offense before — which makes him the delegation scenario: if Brady ever hands off play-calling mid-season, the predictive baseline on this page changes with it. Watch the ledger above.
Defensive coordinator
Jim Leonhard
Aggressive, pressure-oriented 3-4 with multiple fronts, flexible safety deployment and disguise; Leonhard has emphasized an attacking identity
Through Week 4 the defense allows 0.07 EPA per play (23rd in the NFL, bottom-ten). A defense this leaky adds possessions and passing-down snaps for its own offense — game-script fuel for the pass catchers.
Staff continuity
Year 3
Brady's third season calling the Bills offense
A continuing install: same caller, same system, third year. That makes the 2025 column of the table above a legitimate baseline rather than another team's data.
Career dossier
| Stop | Offense | The fingerprint he left |
|---|---|---|
| Panthers · OC2020-21 | 19.9 ppgbest finish 24th in NFL | The Panthers years: TEs took 14% of targets (league 21%) in 2021; the lead back handled 40% of backfield weighted opportunities. |
| Bills · interim OC2023 (play-caller Wk 11 on) | 27 ppg6th in NFL over Wks 11+ | The Bills stint: a league-typical WR/TE/RB target split in 2023 (Wks 11+); the lead back handled 64% of backfield weighted opportunities. |
| Bills · OC2024-25 | 29.6 ppgbest finish 2nd in NFL | The Bills years: a league-typical WR/TE/RB target split in 2025; the lead back handled 65% of backfield weighted opportunities. |
| Bills · HC2026 | 33.7 ppgthrough Week 4, 1st in NFL | The current stop: TEs took 27% of targets (league 23%) in 2026; the lead back handled 88% of backfield weighted opportunities. |
| Positional fantasy finishes under Brady | QB | RB1 | WR1 | TE1 |
|---|---|---|---|---|
| Panthers 2021OC | QB28 | RB36 | WR18 · Moore | TE46 |
| Bills 2023interim OC · Wks 11+ | QB2 · Allen | RB11 · Cook | WR42 | TE15 · Kincaid |
| Bills 2024OC | QB2 · Allen | RB8 · Cook | WR37 | TE30 |
| Bills 2025OC | QB1 · Allen | RB6 · Cook | WR36 | TE20 · Kincaid |
| Bills · 2026pace through Week 4 | QB1 · Allen | RB13 · Cook | WR31 | TE6 · Kincaid |
Positional finishes are season-long PPR ranks from nflverse scoring data. A row with a week range covers only the games he called that season, ranked against the league over the same weeks. Brady's offenses have put up repeated top-ten positional seasons — the system has paid fantasy investors before.
How he distributes the ball
Target split by position across Brady's play-calling seasons since 2016, vs. league average.
Filled bar = Brady offenses · thin marker = league average
No position runs more than a few points from league average under Brady — the target tree follows the talent here, so depth-chart changes move this split more than scheme does.
How he manages a backfield
Lead back's share of backfield weighted opportunities, by season called.
No clean trend: the lead back's share of backfield weighted opportunities (carries + 2×targets) has moved around season to season. Treat the current split as the read and revisit it weekly.
Play-calling by score state
Pass rate when leading, close, and trailing, 2026 through Week 4.
A 4-point pass-rate swing between leading and trailing. Ahead, the backfield eats; behind, the targets spike — check the spread before you set a flex. Play counts are shown so you can weigh each bucket's sample.
The fantasy bottom line: third season of the same play-caller makes this one of the more projectable offenses in the league: shotgun rate below league average (43.6% vs 59%), and play-action rate above league average (31.7% vs 24%). The target tree is league-shaped, and the lead back holds 88% of the backfield's weighted opportunities. Every number on this page is computed from nflverse play-by-play and FTN charting — when it changes, the page changes.
Bills Team Stats 2026
2026 regular season to date.
Points/G (Points scored per game)
33.7
1st of 32 — Top tier up 3 places from last season
Pass Yds/G (Net passing yards per game)
246.7
9th of 32 — Middle tier up 6 places from last season
Rush Yds/G (Rushing yards per game)
155.0
4th of 32 — Top tier down 3 places from last season
Total Yds/G (Total net yards per game)
401.7
4th of 32 — Top tier
Offense & Defense
2026 regular season to date · 3 games.
Ranked against all 32 teams. On defense 1st means fewest allowed, not most.
Offense
What they did
- Points/G — Points scored per game33.71st of 32 — Top tier up 3 places from last season
- Total Yds/G — Total net yards gained per game401.74th of 32 — Top tier
- Yds/Play — Net yards gained per offensive play6.553rd of 32 — Top tier up 2 places from last season
- Pass Yds/G — Net passing yards gained per game246.79th of 32 — Middle tier up 6 places from last season
- Rush Yds/G — Rushing yards gained per game155.04th of 32 — Top tier down 3 places from last season
- Yds/Pass Att — Yards gained per pass attempt9.103rd of 32 — Top tier
- Yds/Carry — Yards gained per rushing attempt5.20T-2nd of 32 — Top tier
- Passer Rtg — Passer rating produced by this offense104.111th of 32 — Middle tier down 7 places from last season
- 3rd Down — Third downs converted54.5%3rd of 32 — Top tier up 1 place from last season
Defense
What they allowed
- Points/G — Points allowed per game26.0T-21st of 32 — Middle tier down 9 places from last season
- Total Yds/G — Total net yards allowed per game361.325th of 32 — Bottom tier down 18 places from last season
- Yds/Play — Net yards allowed per play5.4519th of 32 — Middle tier down 4 places from last season
- Pass Yds/G — Net passing yards allowed per game254.327th of 32 — Bottom tier down 26 places from last season
- Rush Yds/G — Rushing yards allowed per game107.016th of 32 — Middle tier up 12 places from last season
- Yds/Pass Att — Yards allowed per pass attempt7.5222nd of 32 — Middle tier down 18 places from last season
- Yds/Carry — Yards allowed per rushing attempt4.0115th of 32 — Middle tier up 15 places from last season
- Passer Rtg — Passer rating allowed to opposing quarterbacks105.426th of 32 — Bottom tier down 19 places from last season
- 3rd Down — Third downs allowed to convert40.5%17th of 32 — Middle tier up 7 places from last season
Situational & Ball Security
Third and fourth down, the pass rush at both ends of it, and what each side does with the football.
4th Down (Fourth downs converted)
66.7%
T-10th of 32 — Middle tier up 1 place from last season
1st Downs/G (First downs gained per game)
25.3
1st of 32 — Top tier up 3 places from last season
Sacks Allowed (Sacks given up by this offense)
8
T-20th of 32 — Middle tier down 1 place from last season
Sacks (Sacks recorded by this defense)
9
8th of 32 — Top tier up 12 places from last season
Takeaways (Turnovers forced by this defense)
3
T-16th of 32 — Middle tier down 1 place from last season
Giveaways (Turnovers committed by this offense)
5
T-22nd of 32 — Middle tier down 7 places from last season
TO Margin (Turnover differential for the season)
-2
T-24th of 32 — Middle tier down 12 places from last season
Penalty Yds/G (Penalty yards conceded per game)
73.0
27th of 32 — Bottom tier down 11 places from last season
Volume & Play Mix
Opportunity, not quality: how many snaps there are to go round and how they are divided. Ranks here are most to least, with no better end.
Plays/G (Offensive plays run per game)
61.3
15th of 32
Pass Att/G (Pass attempts per game)
28.7
T-24th of 32
Carries/G (Rushing attempts per game)
30.0
8th of 32
Pass TD (Passing touchdowns scored)
5
T-16th of 32 — Middle tier
Rush TD (Rushing touchdowns scored)
8
1st of 32 — Top tier
Opp Plays/G (Plays this defense faces per game)
66.3
T-5th of 32
Own play mix
Pass 51.1%Run 48.9%
How this offense splits its snaps.
Play mix faced
Pass 59.8%Run 40.2%
How opponents attack this defense.
Season History
Every season back to 2022, each number ranked against the 32 teams of that year.
| Season | Pts/G — Points scored per game | Yds/G — Total net yards gained per game | Yds/Play — Net yards gained per offensive play | Pts All — Points allowed per game | Yds All — Total net yards allowed per game | TO +/- — Turnover differential for the season |
|---|---|---|---|---|---|---|
| 2026Current3 games | 33.7 — best of the last 5 seasons1st of 32 | 401.7 — best of the last 5 seasons4th of 32 | 6.55 — best of the last 5 seasons3rd of 32 | 26.0T-21st of 32 | 361.325th of 32 | -2T-24th of 32 |
| 202517 games | 28.3T-4th of 32 | 376.34th of 32 | 5.915th of 32 | 21.512th of 32 | 293.1 — best of the last 5 seasons7th of 32 | +1T-12th of 32 |
| 202417 games | 30.92nd of 32 | 359.110th of 32 | 5.966th of 32 | 21.6T-11th of 32 | 341.517th of 32 | +24 — best of the last 5 seasons1st of 32 |
| 202317 games | 26.56th of 32 | 374.54th of 32 | 5.715th of 32 | 18.34th of 32 | 307.29th of 32 | +2T-12th of 32 |
| 202216 games | 28.42nd of 32 | 397.62nd of 32 | 6.133rd of 32 | 17.9 — best of the last 5 seasons2nd of 32 | 319.16th of 32 | 015th of 32 |
Latest Bills News


Remains limited by shoulder injury
Read report
Knee not viewed as concern
Read report
Active for Week 3
Read report
Absent at start of practice
Read report


View 50 more Bills stories
Bills inactives vs. Chargers | Week 3
Read report
Feeling great following practice
Read report
Practicing, but not taking contact
Read report
Viewed as day-to-day
Read report
Setback not considered serious
Read report
Continues explosive start to season Thursday
Read report
Shreds Lions defense in win
Read report
Another elite performance in win
Read report
Will not return Thursday
Read report
Bills issue injury update on WR DJ Moore
Read report
Questionable to return Thursday
Read report
Exits with apparent injury
Read report
Buffalo Bills inactives vs. Lions | Week 2
Read report







Bills Fantasy Depth Chart
Offensive skill positions only. Order as listed on the team's depth chart.
QB2 players listed

RB3 players listed
WR4 players listed
TE2 players listed

2026 Bills Schedule
Next game
Week 4DivHome vs PatriotsNew England Patriots
- Week 5Away
 at RamsLos Angeles Rams
 - Week 6Away
 at RaidersLas Vegas Raiders
- W1at
 Houston TexansSep 13Won 36 to 31View matchup
 - W2vs
 Detroit LionsSep 17Won 41 to 31View matchup
 - W3vs
 Los Angeles ChargersSep 27Won 24 to 16View matchup
 - W4vsNew England PatriotsOct 41:00 PM ETView matchup
- W5atLos Angeles RamsOct 128:15 PM ETView matchup
- W6atLas Vegas RaidersOct 184:25 PM ETView matchup
- W7Bye week
- W8vs
 Baltimore RavensNov 11:00 PM ETView matchup
 - W9at
 Minnesota VikingsNov 98:15 PM ETView matchup
 - W10at
 New York JetsNov 151:00 PM ETView matchup
 - W11vs
 Miami DolphinsNov 221:00 PM ETView matchup
 - W12vs
 Kansas City ChiefsNov 268:20 PM ETView matchup
 - W13atNew England PatriotsDec 64:25 PM ETView matchup
- W14at
 Green Bay PackersDec 138:20 PM ETView matchup
 - W15vs
 Chicago BearsDec 198:20 PM ETView matchup
 - W16at
 Denver BroncosDec 254:30 PM ETView matchup
 - W17atMiami DolphinsJan 31:00 PM ETView matchup
- W18vsNew York JetsJan 10TBDView matchup
Explore StatChasers
- Fantasy Football ToolsThe #1 ranked fantasy football toolset.Open
- Advanced Player StatsDeeper numbers on every player in the league.Open
- Strength of ScheduleMatchup difficulty by fantasy position, including the playoff weeks.Open
- Fantasy Points AllowedHow Buffalo's defense performs against QB, RB, WR and TE.Open
Common questions
Who are the best Buffalo Bills players to draft in fantasy football in 2026?
Josh Allen and James Cook are the top fantasy options for the Bills in 2026. Josh Allen projects as an elite QB1. James Cook projects as a top-five RB1.
Is Josh Allen a QB1 in fantasy football in 2026?
Yes. In 2026, Allen projects as an elite QB1. The passing line came down and it did not matter, because the touchdowns moved to his legs.
What is DJ Moore's fantasy outlook with the Bills?
In 2026, Moore projects as an upside WR3. The most accomplished route-runner Buffalo has ever handed Allen.
Who is the Buffalo Bills starting running back in 2026?
James Cook leads the Bills backfield in 2026 and projects as a top-five RB1. Ray Davis is the other half of the backfield, a handcuff with standalone weeks.
Is Ray Davis worth drafting in fantasy football in 2026?
Behind James Cook, Davis projects as a handcuff with standalone weeks. The only back who matters if Cook's 342 touches catch up with him.
Who is the Bills WR2 behind DJ Moore?
Behind DJ Moore, Khalil Shakir projects as a WR4 with a safe floor. Led the team in targets and receptions, and it took only 95 looks to do it.
Is Dalton Kincaid a good fantasy tight end in 2026?
In 2026, Kincaid projects as a TE1 upside, TE2 risk. The most efficient pass-catcher on the roster, in the fewest games.
Who is the Buffalo Bills fantasy football sleeper for 2026?
Keon Coleman is the Bills sleeper to watch in 2026. Two seasons in, the production has not caught up to the draft slot.
Is the Buffalo Bills offense good for fantasy football in 2026?
Josh Allen and James Cook headline the Bills in 2026. Allen and Cook are the offence and both are priced like it. Everything after them is a bet on a passing game whose leading receiver managed 719 yards — DJ Moore is the reason to think that number moves, and a first-year head coach is the reason not to assume it.
Common questions
Who leads the Buffalo Bills in target share?
DJ Moore leads the Buffalo Bills with a 20.9% target share through Week 4, up 10.9 points since Week 1. Dalton Kincaid is second at 19.8%.
Common questions
How does Joe Brady's play-calling affect Bills fantasy players?
Joe Brady is calling the Bills offense for the third straight season, so last year's tendencies remain predictive. Through Week 4 2026, the offense shows shotgun rate below league average (43.6% vs 59%) and play-action rate above league average (31.7% vs 24%). The lead back handles 88% of backfield weighted opportunities. All numbers are derived from nflverse play-by-play data.
Common questions
2026 regular season to date · 3 games.
How many points per game are the Buffalo Bills averaging in 2026?
The Bills are averaging 33.7 points per game through 3 games of the 2026 season, 1st in the NFL. They scored 28.3 per game in 2025. Only 3 games have been played, so these figures and ranks will still move a lot.
How many yards per game are the Bills averaging in 2026?
Buffalo is averaging 401.7 total yards per game through 3 games of the 2026 season, 4th in the NFL — 246.7 passing and 155.0 rushing.
How does the Bills offense rank in the NFL in 2026?
Through 3 games of the 2026 season, the Bills offense ranks 1st in points per game (33.7) and 3rd in yards per play (6.55). Only 3 games have been played, so these figures and ranks will still move a lot.
How good is the Bills defense in 2026?
Buffalo has allowed 26.0 points and 361.3 total yards per game through 3 games of the 2026 season. That is tied for the 21st-fewest points allowed in the NFL. Opponents are averaging 5.45 yards a play, the 19th-fewest allowed. Only 3 games have been played, so these figures and ranks will still move a lot.
Are the Bills better at passing or running the ball in 2026?
Buffalo has averaged 246.7 passing yards and 155.0 rushing yards per game through 3 games of the 2026 season. That is 9.10 yards per pass attempt compared with 5.20 per carry.
How often do the Bills pass the ball?
51.1% of Buffalo's offensive plays have been passes and 48.9% runs through 3 games of the 2026 season. They run 61.3 plays a game, the 15th-most in the league.
What is the Buffalo Bills turnover margin in 2026?
The Bills have a -2 turnover margin through 3 games of the 2026 season. They have committed 5 giveaways and forced 3 takeaways.
How do the 2026 Bills compare with the 2025 team?
Buffalo is averaging 33.7 points and 401.7 total yards per game through 3 games of the 2026 season. In 2025 the Bills averaged 28.3 points and 376.3 total yards. Only 3 games have been played, so these figures and ranks will still move a lot.
Common questions
Who is the Buffalo Bills starting quarterback?
Josh Allen is the Bills' starting quarterback. Kyle Allen is listed behind Josh Allen on the fantasy depth chart.
Who is the Buffalo Bills starting running back?
James Cook leads the Bills running back depth chart, followed by Ty Johnson and Ray Davis.
Who is the Bills WR1?
DJ Moore is listed as the Bills' WR1 on the current fantasy depth chart. Khalil Shakir, Keon Coleman and Joshua Palmer follow DJ Moore in the wide receiver rotation.
What is the Buffalo Bills wide receiver depth chart?
Buffalo's fantasy wide receiver depth chart currently lists DJ Moore as WR1, Khalil Shakir as WR2, Keon Coleman as WR3 and Joshua Palmer as WR4.
Who is the Buffalo Bills starting tight end?
Dalton Kincaid is the Bills' starting tight end, with Dawson Knox listed behind Dalton Kincaid at TE2.
Who is the Buffalo Bills backup quarterback?
Kyle Allen is the backup quarterback behind Josh Allen on the current Bills fantasy depth chart.
How often is the Bills depth chart updated?
The Bills fantasy depth chart is updated as roster moves, injuries and role changes affect the team's offensive hierarchy.
Common questions
Who do the Buffalo Bills play next?
The Bills' next game is Week 4 against the New England Patriots at Highmark Stadium. Kickoff is scheduled for Sunday, October 4 at 1:00 PM ET. The game is on CBS.
What is the Buffalo Bills schedule for 2026?
The Bills play 17 regular-season games in 2026, opening in Week 1 against the Houston Texans at Reliant Stadium and finishing in Week 18 against the New York Jets at Highmark Stadium. Every week's date, opponent, venue, network and result is listed in the schedule above.
When is the Buffalo Bills bye week in 2026?
The Bills are on bye in Week 7 of the 2026 season, between their Week 6 game against the Las Vegas Raiders and their Week 8 game against the Baltimore Ravens. The bye is listed in the schedule above as its own week, with no fixture against it.
How many home games do the Buffalo Bills have in 2026?
Buffalo has 8 home games in 2026, all of them at Highmark Stadium. Each one is marked HOME in the schedule above.
Who do the Bills play in the AFC East?
The Bills play 6 division games in 2026, home and away against the New England Patriots, New York Jets and Miami Dolphins. Division games are marked DIV in the schedule above.
When do the Bills play the Patriots?
The Bills face the New England Patriots in Week 4 at Highmark Stadium on Sunday, October 4 at 1:00 PM ET and Week 13 at Gillette Stadium on Sunday, December 6 at 4:25 PM ET.
When do the Bills play the Jets?
The Bills face the New York Jets in Week 10 at MetLife Stadium on Sunday, November 15 at 1:00 PM ET and Week 18 at Highmark Stadium on Sunday, January 10.
When do the Bills play the Dolphins?
The Bills face the Miami Dolphins in Week 11 at Highmark Stadium on Sunday, November 22 at 1:00 PM ET and Week 17 at Hard Rock Stadium on Sunday, January 3 at 1:00 PM ET.
What channel are Buffalo Bills games on in 2026?
2026 Bills games are scheduled on CBS, FOX, ESPN, NBC, Prime Video and Netflix. CBS carries the most with 8 games. The network for each week is shown in the schedule above; 1 game has no broadcast window assigned yet and shows none.
Where can I see Buffalo Bills scores and results?
Every completed game shows its final score in the schedule above, and upcoming games show the date, venue and network instead. The Bills are 3-0 through 3 games in 2026, most recently beat the Los Angeles Chargers 24-16 in Week 3.