

Chicago Bears vs Minnesota Vikings, Week 15 2024
 Chicago Bears
Away
12
 Minnesota Vikings
HomeWon
30
| Team | Q1 | Q2 | Q3 | Q4 | Final |
|---|---|---|---|---|---|
| Bears | 0 | 0 | 3 | 9 | 12 |
| Vikings | 10 | 3 | 7 | 10 | 30 |
CHI 12MIN 30 Final
Passing leader
12.2PPR pts
24/40, 231 YDS, 1 TD, 1 INT
Top fantasy scorer
20.3PPR pts
7 REC, 73 YDS, 1 TD
Bears leader
20.2PPR pts
6 REC, 82 YDS, 1 TD
Defensive playmaker
Tyrique Stevenson Sr.
1 INT, 4 TKL
Vikings 30, Bears 12: Minnesota leads from start to finish
Minnesota led 13–0 at halftime and outscored Chicago 17–12 after the break to win 30–12. The Vikings finished with a 329–284 edge in total offense and averaged 4.6 yards per play.
Chicago didn't get on the board until the third quarter.
The Bears went 1-for-12 on third down and committed one turnover.
The two teams meet again in Week 18 of 2026. If you roster anyone from either side, run the start/sit call in Redraft Command and it will weigh your lineup, your opponent and your league scoring, not only the player rankings.
Key advantages
- +0.1 yards/play MIN 4.6 · CHI 4.5
- +45 total yards MIN 329 · CHI 284
- +42% third-down rate MIN 50% · CHI 8%
Game Highlights
Official NFL highlights · Opens from YouTube
Got a Bear or Viking on your fantasy team?
Check their next matchup with the Start/Sit Tool, compare their value in the Fantasy Trade Calculator, or connect your league for personalized advice in Redraft Command.
Works with Sleeper, ESPN and Fleaflicker. No password needed.
Why the Vikings Won
Minnesota won the efficiency and third-down battles.
| Bears | Stat | Vikings |
|---|---|---|
| 4.5 | Yards per play | 4.6 |
| 284 | Total yards | 329 |
| 8% | Third-down conversion | 50% |
| Other team stats | ||
| 63 | Plays | 71 |
| 1 | Turnovers | 1 |
| 30:06 | Time of possession | 29:54 |
Scoring Summary
The Vikings scored three touchdowns and three field goals; the Bears scored one touchdown and two field goals.
| Time | Team | Play | CHI | MIN |
|---|---|---|---|---|
| 1st quarter | ||||
| 12:04 | MIN | Will Reichard 52-yard FG Takes lead | 0 | 3 |
| 5:04 | MIN | Sam Darnold → Justin Jefferson, 7-yard TD Extends leadWill Reichard XP | 0 | 10 |
| 2nd quarter | ||||
| 0:04 | MIN | Will Reichard 31-yard FG Extends lead | 0 | 13 |
| 3rd quarter | ||||
| 7:02 | CHI | Cairo Santos 29-yard FG | 3 | 13 |
| 1:38 | MIN | Aaron Jones 1-yard TD run Extends leadWill Reichard XP | 3 | 20 |
| 4th quarter | ||||
| 13:00 | CHI | Cairo Santos 39-yard FG | 6 | 20 |
| 10:14 | MIN | Cam Akers 1-yard TD run Extends leadWill Reichard XP | 6 | 27 |
| 5:19 | CHI | Caleb Williams → Keenan Allen, 16-yard TD2-pt try failed | 12 | 27 |
| 1:12 | MIN | Will Reichard 46-yard FG Extends lead | 12 | 30 |
Fantasy Points: Bears vs Vikings, Week 15 2024
Fantasy leaders
- Justin Jefferson20.3 PTSWR13
- Keenan Allen20.2 PTSWR14
- Aaron Jones18.6 PTSRB8
- DJ Moore15.0 PTSWR26
Player Stats
Quarterbacks
| Player | FPTS | FIN | CMP/ATT | Pass YDS | TD | INT | Rush ATT | Rush YDS | Rush TD | Rate | Start/Sit |
|---|---|---|---|---|---|---|---|---|---|---|---|
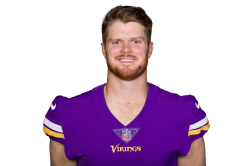
| Sam Darnold | 12.2 | QB20 | 24/40 | 231 | 1 | 1 | — | — | — | 74.1 | Start/Sit → |
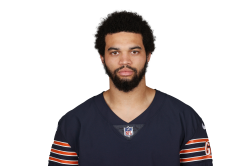
| Caleb Williams | 9.9 | QB23 | 18/31 | 191 | 1 | 0 | 4 | 3 | 0 | 86.9 | Start/Sit → |
| Tyson Bagent | 0.2 | QB39 | 1/1 | 5 | 0 | 0 | — | — | — | 87.5 | Start/Sit → |

WRs, RBs, & TEs
| Player | FPTS | FIN | POS | Rush ATT | Rush YDS | Rush TD | TGT | REC | Rec YDS | Rec TD | Start/Sit |
|---|---|---|---|---|---|---|---|---|---|---|---|
| Justin Jefferson | 20.3 | WR13 | WR | — | — | — | 14 | 7 | 73 | 1 | Start/Sit → |
| Keenan Allen | 20.2 | WR14 | WR | — | — | — | 13 | 6 | 82 | 1 | Start/Sit → |
| Aaron Jones | 18.6 | RB8 | RB | 18 | 86 | 1 | 3 | 2 | 20 | 0 | |
| DJ Moore | 15.0 | WR26 | WR | 3 | 24 | 0 | 8 | 8 | 46 | 0 | Start/Sit → |
| Jordan Addison | 13.3 | WR29 | WR | — | — | — | 9 | 7 | 63 | 0 | Start/Sit → |
| T.J. Hockenson | 10.2 | TE10 | TE | — | — | — | 7 | 5 | 52 | 0 | Start/Sit → |
| D'Andre Swift | 9.9 | RB28 | RB | 19 | 79 | 0 | 1 | 1 | 10 | 0 | Start/Sit → |
| Cam Akers | 8.4 | RB34 | RB | 10 | 24 | 1 | — | — | — | — | |
| Rome Odunze | 5.9 | WR62 | WR | — | — | — | 7 | 2 | 39 | 0 | Start/Sit → |
| Cole Kmet | 2.4 | TE43 | TE | — | — | — | 1 | 1 | 14 | 0 | Start/Sit → |
| Brandon Powell | 2.2 | WR95 | WR | — | — | — | 1 | 1 | 12 | 0 | |
| Trent Sherfield | 1.6 | WR106 | WR | — | — | — | 1 | 1 | 6 | 0 | |
| Jalen Nailor | 1.5 | WR108 | WR | — | — | — | 1 | 1 | 5 | 0 | Start/Sit → |
| Tyler Scott | 1.5 | WR109 | WR | — | — | — | 1 | 1 | 5 | 0 | |
| Travis Homer | 0.7 | RB72 | RB | 3 | 7 | 0 | — | — | — | — | Start/Sit → |
| Ty Chandler | 0.4 | RB75 | RB | 1 | 4 | 0 | — | — | — | — | |
| Johnny Mundt | 0.0 | — | TE | — | — | — | 1 | 0 | 0 | 0 | Start/Sit → |





Fantasy Usage
Chicago Bears
Snap Share
Target Share31 targets
- Keenan Allen42%, 13 targets
- DJ Moore26%, 8 targets
- Rome Odunze23%, 7 targets
- D'Andre Swift3%, 1 targets
- Cole Kmet3%, 1 targets
- Other3%, 1 targets
Carry Share29 carries
- , 19 carries
- , 4 carries
- , 3 carries
- , 3 carries
Minnesota Vikings
Snap Share
Target Share37 targets
- Justin Jefferson38%, 14 targets
- Jordan Addison24%, 9 targets
- T.J. Hockenson19%, 7 targets
- Aaron Jones8%, 3 targets
- Johnny Mundt3%, 1 targets
- Other8%, 3 targets
Carry Share29 carries
- , 18 carries
- , 10 carries
- , 1 carries
View full usage tableHide full usage table
| Player | SNAPS | SNAP % | TGT | TGT % | CAR |
|---|---|---|---|---|---|
| Cole Kmet | 62 | 93% | 1 | 3% | 0 |
| Justin Jefferson | 68 | 88% | 14 | 38% | 0 |
| DJ Moore | 58 | 87% | 8 | 26% | 3 |
| Jordan Addison | 66 | 86% | 9 | 24% | 0 |
| Keenan Allen | 55 | 82% | 13 | 42% | 0 |
| Rome Odunze | 53 | 79% | 7 | 23% | 0 |
| D'Andre Swift | 46 | 69% | 1 | 3% | 19 |
| T.J. Hockenson | 50 | 65% | 7 | 19% | 0 |
| Aaron Jones | 47 | 61% | 3 | 8% | 18 |
| Jalen Nailor | 41 | 53% | 1 | 3% | 0 |
| Josh Oliver | 36 | 47% | 0 | 0% | 0 |
| Cam Akers | 21 | 27% | 0 | 0% | 10 |
| Johnny Mundt | 20 | 26% | 1 | 3% | 0 |
| Marcedes Lewis | 17 | 25% | 0 | 0% | 0 |
| Travis Homer | 17 | 25% | 0 | 0% | 3 |
| Gerald Everett | 11 | 16% | 0 | 0% | 0 |
| Collin Johnson | 11 | 16% | 0 | 0% | 0 |
| Trent Sherfield | 12 | 16% | 1 | 3% | 0 |
| Brandon Powell | 7 | 9% | 1 | 3% | 0 |
| Tyler Scott | 4 | 6% | 1 | 3% | 0 |
| Ty Chandler | 1 | 1% | 0 | 0% | 1 |

Fantasy Points vs Expected
Expected points (xFP) are what a player's pass attempts, carries and targets are worth at the league's average rates; the difference is what the player made of them.
- Biggest overperformer+1.9Cam Akers8.4 PTS vs 6.5 xFP
- Biggest underperformer−6.5Caleb Williams9.9 PTS vs 16.4 xFP
- Highest expected volume24.0 xFPJustin Jefferson20.3 PTS scored
| Player | PTS | xFP | vs xFP | Snap% | Usage | Rte% | Pass att | Car | Car% | Tgt | Tgt% |
|---|---|---|---|---|---|---|---|---|---|---|---|
| Justin JeffersonMIN · WR | 20.3 | 24.0 | −3.7 | 88% | 38% tgt | — | 0 | 0 | 0% | 14 | 38% |
| Keenan AllenCHI · WR | 20.2 | 22.3 | −2.1 | 82% | 42% tgt | — | 0 | 0 | 0% | 13 | 42% |
| Sam DarnoldMIN · QB | 12.2 | 17.8 | −5.6 | 100% | 40 att | — | 40 | 0 | 0% | 0 | 0% |
| Aaron Jones Sr.MIN · RB | 18.6 | 16.9 | +1.7 | 61% | 62% car | — | 0 | 18 | 62% | 3 | 8% |
| Caleb WilliamsCHI · QB | 9.9 | 16.4 | −6.5 | 96% | 31 att | — | 31 | 4 | 14% | 0 | 0% |
| DJ MooreCHI · WR | 15.0 | 15.7 | −0.7 | 87% | 26% tgt | — | 0 | 3 | 10% | 8 | 26% |
| Jordan AddisonMIN · WR | 13.3 | 15.4 | −2.1 | 86% | 24% tgt | — | 0 | 0 | 0% | 9 | 24% |
| D'Andre SwiftCHI · RB | 9.9 | 14.1 | −4.2 | 69% | 66% car | — | 0 | 19 | 66% | 1 | 3% |
| Rome OdunzeCHI · WR | 5.9 | 12.0 | −6.1 | 79% | 23% tgt | — | 0 | 0 | 0% | 7 | 23% |
| T.J. HockensonMIN · TE | 10.2 | 12.0 | −1.8 | 65% | 19% tgt | — | 0 | 0 | 0% | 7 | 19% |
| Cam AkersMIN · RB | 8.4 | 6.5 | +1.9 | 27% | 34% car | — | 0 | 10 | 34% | 0 | 0% |
| Travis HomerCHI · RB | 0.7 | 2.0 | −1.3 | 25% | 10% car | — | 0 | 3 | 10% | 0 | 0% |
| Brandon PowellMIN · WR | 2.2 | 1.7 | +0.5 | 9% | 3% tgt | — | 0 | 0 | 0% | 1 | 3% |
| Cole KmetCHI · TE | 2.4 | 1.7 | +0.7 | 93% | 3% tgt | — | 0 | 0 | 0% | 1 | 3% |
| Jalen NailorMIN · WR | 1.5 | 1.7 | −0.2 | 53% | 3% tgt | — | 0 | 0 | 0% | 1 | 3% |
| Johnny MundtMIN · TE | 0.0 | 1.7 | −1.7 | 26% | 3% tgt | — | 0 | 0 | 0% | 1 | 3% |
| Trent SherfieldMIN · WR | 1.6 | 1.7 | −0.1 | 16% | 3% tgt | — | 0 | 0 | 0% | 1 | 3% |
| Tyler ScottCHI · WR | 1.5 | 1.7 | −0.2 | 6% | 3% tgt | — | 0 | 0 | 0% | 1 | 3% |
| Ty ChandlerMIN · RB | 0.4 | 0.7 | −0.3 | 1% | 3% car | — | 0 | 1 | 3% | 0 | 0% |
| Tyson BagentCHI · QB | 0.2 | 0.4 | −0.2 | 4% | 1 att | — | 1 | 0 | 0% | 0 | 0% |
Team totals: Bears 31 targets and 29 carries; Vikings 37 targets and 29 carries. Shares are from the box score. Snap counts are from the weekly player logs (Sleeper), and include plays wiped out by penalties. Route counts, air yards and red-zone touches appear when the tracking feed is connected. League-average rates from the 2024 season: 1.71 PPR points per target (68% catch rate), 0.65 per carry and 0.44 per pass attempt. They don't adjust for field position or target depth.
Fantasy Verdicts
Caleb Williams Unlucky
18 of 31 passing for 191 yards, 1 touchdown; 4 carries for 3 yards.
Verdict: The role was there, worth 16.4 points at league-average rates; the production wasn't.
Fewest points since Week 10.
Sam Darnold Unlucky
24 of 40 passing for 231 yards, 1 touchdown, 1 interception.
Verdict: The role was there, worth 17.8 points at league-average rates; the production wasn't.
Fewest points since Week 10.
Keenan Allen Volume, no payoff
13 targets (42% of the team's), 6 catches for 82 yards and 1 touchdown.
Verdict: The points matched the role, 22.3 expected.
DJ Moore
8 targets (26% of the team's), 8 catches for 46 yards; 3 carries (10% of the team's) for 24 yards.
Verdict: The points matched the role, 15.7 expected.
Justin Jefferson Volume, no payoff
14 targets (38% of the team's), 7 catches for 73 yards and 1 touchdown.
Verdict: The points matched the role, 24.0 expected.
Aaron Jones Sr. Strong role
3 targets (8% of the team's), 2 catches for 20 yards; 18 carries (62% of the team's) for 86 yards and 1 touchdown.
Verdict: The points matched the role, 16.9 expected.
Rome Odunze Unlucky
7 targets (23% of the team's), 2 catches for 39 yards.
Verdict: The role was there, worth 12.0 points at league-average rates; the production wasn't.
Johnny Mundt
1 target (3% of the team's), 0 catches for 0 yards.
Verdict: The points matched the role, 1.7 expected.
Stock Up, Stock Down
Minnesota Vikings
- Stock down: Johnny Mundt played 26% of the snaps, down from a 48% season average.
- Stock down: Ty Chandler played 1% of the snaps, down from a 23% season average.
Fantasy Matchups
Fantasy points allowed per game by position, 2024 through Week 18.
| Points allowed to | Bears D | Vikings D |
|---|---|---|
| QBs | 13.8 | 15.5 |
| RBs | 25.2 | 18.8 |
| WRs | 28.9 | 39.7 |
| TEs | 12.3 | 11.3 |
Regular season, summed from each game's box score and scored with this page's rules.
How the Game Swung
Minnesota opened at 50% win probability and passed 98% in the third quarter on the way to the win.
Vikings win probability
Key Swings
- +9Reichard 52-yd FG50% → 59%Q1 12:04
- +20Darnold → Jefferson, 7-yd TD60% → 79%Q1 5:04
- +6Reichard 31-yd FG85% → 91%Q2 0:04
- −5Santos 29-yd FG94% → 89%Q3 7:02
- +7Jones 1-yd TD run92% → 99%Q3 1:38
Swing in Vikings win probability, in points
Play Calling and Possessions
| Chicago Bears | Measure | Minnesota Vikings |
|---|---|---|
| 63 | Plays | 71 |
| 54% | Pass rate | 59% |
| 5.0 | Yds / dropback | 5.1 |
| 3.9 | Yds / carry | 3.9 |
| 1/12 | Third downs | 7/14 |
Efficiency edge Minnesota ran 8 more plays than Chicago.
- Top targets
- CHI Allen 42% · Moore 26% · Odunze 23%
- MIN Jefferson 38% · Addison 24% · Hockenson 19%
Possession Results
| Result | CHI | MIN |
|---|---|---|
| Touchdowns | 1 | 3 |
| Field goals | 2 | 3 |
| Punts | 3 | 3 |
| Turnovers | 1 | 1 |
| Turnovers on downs | 2 | 0 |
- The Vikings opened the scoring on their first possession, a 4-play, 5-yard drive that ended in a field goal.
- The Vikings drained the clock with two second-half drives of four to six minutes.
All 21 possessions, drive by drive
| Team | Start | Plays | Yards | Time | Result |
|---|---|---|---|---|---|
| CHI | Q1 15:00 | 4 | 9 | 2:03 | Downs |
| MIN | Q1 12:57 | 4 | 5 | 0:53 | Field goal |
| CHI | Q1 12:04 | 8 | 25 | 4:30 | Fumble |
| MIN | Q1 7:34 | 5 | 39 | 2:30 | Touchdown |
| CHI | Q1 5:04 | 5 | 13 | 2:51 | Punt |
| MIN | Q1 2:13 | 15 | 68 | 7:38 | Interception |
| CHI | Q2 9:35 | 11 | 55 | 7:00 | Downs |
| MIN | Q2 2:35 | 13 | 58 | 2:31 | Field goal |
| CHI | Q2 0:04 | 1 | -1 | 0:04 | End of half |
| MIN | Q3 15:00 | 3 | -10 | 1:13 | Punt |
| CHI | Q3 13:47 | 5 | 24 | 2:08 | Punt |
| MIN | Q3 11:39 | 3 | 7 | 0:59 | Punt |
| CHI | Q3 10:40 | 9 | 47 | 3:38 | Field goal |
| MIN | Q3 7:02 | 12 | 70 | 5:24 | Touchdown |
| CHI | Q3 1:38 | 10 | 49 | 3:38 | Field goal |
| MIN | Q4 13:00 | 7 | 70 | 2:46 | Touchdown |
| CHI | Q4 10:14 | 3 | -2 | 2:08 | Punt |
| MIN | Q4 8:06 | 5 | 6 | 1:53 | Punt |
| CHI | Q4 6:13 | 6 | 27 | 0:54 | Touchdown |
| MIN | Q4 5:19 | 7 | 14 | 4:07 | Field goal |
| CHI | Q4 1:12 | 3 | 8 | 1:12 | End of game |
About these numbers
Possessions that ended with the clock running out at the half or the end of the game aren't counted.
Personnel groupings, average depth of target and pass rate over expected appear when the tracking feed is connected.
Bears vs Vikings Head-to-Head
The Bears and Vikings first met in 1961 and have played 131 times since. They have been NFC North rivals since 1970.
- All-time series
- 70–59–2Vikings lead, 131 meetings since 1961
- Postseason
- 1–0Bears won in 1994
- Largest Bears win
- 38–71989
- Largest Vikings win
- 31–01969
Since 2021
9–2 Vikings lead
11 meetings since the 2021 season, regular season and playoffs.
Oldest to newest. V = Vikings win, B = Bears win, outlined = this game.
2026 Meetings
- Week 18 Bears at Vikings Upcoming
Recent Meetings
- 2026 Wk 2 Vikings at Bears, 2026 Wk 2 recap MIN 9 CHI 3 MIN W
- 2025 Wk 11 Bears at Vikings, 2025 Wk 11 recap CHI 19 MIN 17 CHI W
- 2025 Wk 1 Vikings at Bears, 2025 Wk 1 recap MIN 27 CHI 24 MIN W
- 2024 Wk 15 Bears at Vikings MIN 30 CHI 12 MIN W
- 2024 Wk 12 Vikings at Bears, 2024 Wk 12 recap MIN 30 CHI 27 MIN W
- 2023 Wk 12 Bears at Vikings, 2023 Wk 12 recap CHI 12 MIN 10 CHI W
- 2023 Wk 6 Vikings at Bears, 2023 Wk 6 recap MIN 19 CHI 13 MIN W
- 2022 Wk 18 Vikings at Bears, 2022 Wk 18 recap MIN 29 CHI 13 MIN W
- 2022 Wk 5 Bears at Vikings, 2022 Wk 5 recap MIN 29 CHI 22 MIN W
- 2021 Wk 18 Bears at Vikings, 2021 Wk 18 recap MIN 31 CHI 17 MIN W
- 2021 Wk 15 Vikings at Bears, 2021 Wk 15 recap MIN 17 CHI 9 MIN W
Season to Date (Through Week 18)
The 2024 regular season, from each game's box score.
| Bears | Stat | Vikings |
|---|---|---|
| 5-12 | Record | 14-3 |
| 18.2 | Points per game | 25.4 |
| 283.5 | Yards per game | 346.9 |
| 4.5 | Yards per play | 5.6 |
| 21.8 | Points allowed per game | 19.5 |
| 354.2 | Yards allowed per game | 335.4 |
Bears vs Vikings Fantasy Outlook for 2026
One meeting is left on the 2026 schedule: Week 18 in Minnesota. Here's how to decide who to play in your league.
- Start/Sit ToolShould your Bears or Vikings player start in Week 18? Compare the decision against your other options.
- Fantasy Football ProjectionsSee the latest weekly and rest-of-season projections for Bears and Vikings players.
- Fantasy Points Allowed by PositionHow the Bears and Vikings defenses have treated QBs, RBs, WRs and TEs.
- Strength of ScheduleWhere this matchup falls in each team's fantasy playoff run.
- Redraft CommandConnect your league for personalized lineup, trade and roster advice.
Keep Exploring
2024 Game Logs for Players in This Game
Bears vs Vikings Game FAQ
Who won the 2024 Bears vs Vikings Week 15 game?
The Minnesota Vikings beat the Chicago Bears 30–12 in Week 15 of the 2024 season. The game was played at U.S. Bank Stadium in Minneapolis, MN, on December 16, 2024. See the Vikings' 2024 schedule.
What was the final score of Bears vs Vikings?
The final score was Vikings 30, Bears 12. The Vikings led 13–0 at halftime, and the second half went Bears 12, Vikings 17.
What happened in the Bears vs Vikings game?
Minnesota led 13–0 at halftime and outscored Chicago 17–12 after the break to win 30–12. The Vikings finished with a 329–284 edge in total offense and averaged 4.6 yards per play. Justin Jefferson led all players with 7 catches for 73 yards and a touchdown.
Who scored the most fantasy points in Bears vs Vikings?
Justin Jefferson led the game with 20.3 PPR fantasy points, the WR13 of Week 15, on 7 catches for 73 yards and a touchdown. Keenan Allen was next with 20.2 (WR14). See Justin Jefferson's 2024 game log.
Who led Bears vs Vikings in passing, rushing and receiving?
Sam Darnold (MIN) led all passers with 24 of 40 for 231 yards, a touchdown and an interception. Aaron Jones (MIN) led in rushing with 18 carries for 86 yards and a touchdown. Keenan Allen (CHI) led in receiving with 6 catches for 82 yards and a touchdown.
How many fantasy points did Justin Jefferson score against the Bears?
Justin Jefferson scored 20.3 points in PPR leagues, 16.8 in half-PPR and 13.3 in standard scoring against the Bears in Week 15 of the 2024 season, on 7 catches for 73 yards and a touchdown. He drew 38% of his team's targets.
Who outperformed and underperformed expected fantasy points in Bears vs Vikings?
Cam Akers outperformed his expected fantasy points the most, scoring 8.4 PPR points on 6.5 xFP (+1.9). Caleb Williams fell furthest short, with 9.9 points on 16.4 xFP (−6.5). A gap either way reflects efficiency and touchdowns in one game; it is not a forecast. For matchups ahead, see fantasy points allowed by position.
Who had the highest expected fantasy points in Bears vs Vikings?
Justin Jefferson had the most fantasy opportunity in the game, worth 24.0 expected PPR points (xFP) at league-average rates, and scored 20.3. Expected points measure the volume of a player's pass attempts, carries and targets, not how well he used them.
How did the Vikings beat the Bears?
The Vikings beat the Bears 30–12 because they averaged 4.6 yards per play to 4.5 and outgained them 329–284.
What is the all-time Bears vs Vikings record?
The Vikings lead the all-time series 70–59–2 across 131 meetings since 1961, including a 0–1 record in the postseason.
When did the Bears and Vikings last play before this game?
Before Week 15 of 2024, they last met in the 2024 season on November 24, 2024, when the Vikings beat the Bears 30–27.
Have the Bears and Vikings met in the playoffs?
Yes, 1 time, most recently in the 1994 playoffs. The Bears are 1–0 against the Vikings in the postseason.
What is the Bears vs Vikings record since 2021?
The Vikings lead 9–2 across 11 meetings since the 2021 season, including this game.